
Crashupload
Overview
Crash dumping system facilitates service providers or developers to collect crashes happened in the set-top boxes and do the debugging in offline. Crash dumping system is a debug supporting system, which consists of Crash dumping server(s) with user interfaces. Crash dumping server collect crash logs which happened in the connected STBs, process these logs and store for future reference.
Crash log is a log file automatically created on Set top boxes when a crash occurs. This information is useful for offline debugging.
Minidump
- A list of the executable and shared libraries that were loaded in the process at the time the dump was created. This list includes both file names and identifiers for the particular versions of those files that were loaded.
- A list of threads present in the process. For each thread, the minidump includes the state of the processor registers, and the contents of the threads’ stack memory.
- Other information about the system on which the dump was collected: processor and operating system versions, the reason for the dump, and so on.
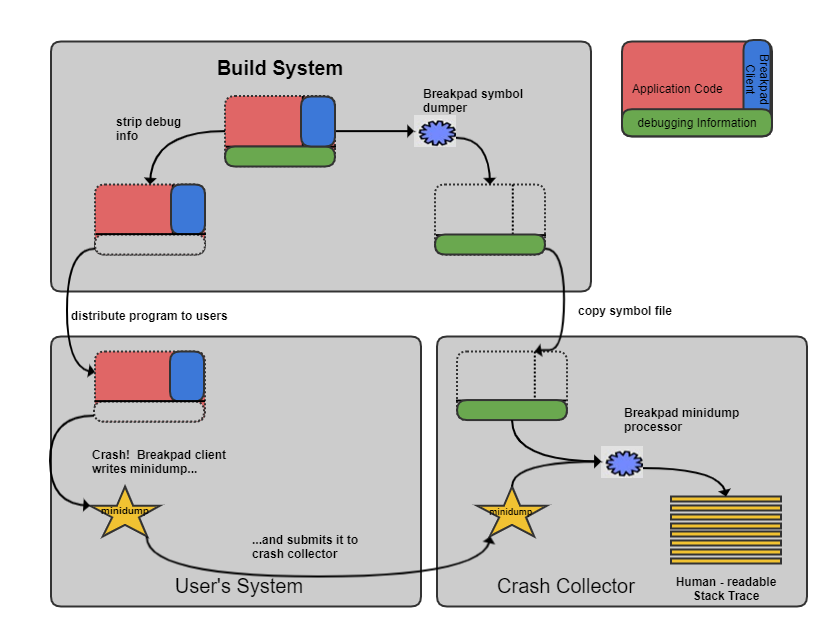
Google Breakpad
Breakpad is a library that records crashes in compact “minidump” files. It produce C and C++ stack traces from minidumps. Breakpad can also write minidumps on request for programs that have not crashed.
How to Integrate Google Breakpad library?
-
Link against libbreakpad_client library.
-
#include “client/linux/handler/exception_handler.h“
- Instantiate an ExceptionHandler object, ExceptionHandler constructor requires a path where it can write minidumps, as well as a callback function to receive information about minidumps that were written.
#include "client/linux/handler/exception_handler.h“ // Include Header file for exception handler
static bool dumpCallback(const google_breakpad::MinidumpDescriptor& descriptor, void* context, bool succeeded)
{
  printf("Dump path: %sn", descriptor.path());
  return succeeded;
}

int main(int argc, char* argv[])
{
  google_breakpad::MinidumpDescriptor descriptor("/tmp");
  google_breakpad::ExceptionHandler eh(descriptor, // Minidump will be saved in /tmp
                                       NULL,
                                       dumpCallback, //Callback
                                       NULL,
                                       true,
Google Breakpad Utilities
- dump_syms is used for symbol extraction.
- minidump_stackwalk is used for symbolized stack trace
It takes a minidump and its corresponding text-format symbols and produce a symbolized stacktrace.
minidump_stackwalk minidump.dmp gpsample_app.sym
uploadDumps.sh collects core dumps/ mini dumps to crash server whenever any applications crashes.
Sample Application
#include "client/linux/handler/exception_handler.h“
static bool dumpCallback(const google_breakpad::MinidumpDescriptor& descriptor,
                         void* context,
                         bool succeeded)
{
  printf("Dump path: %sn", descriptor.path());
  return succeeded;
}

void crash()
{
  volatile int* a = (int*)(NULL);
  *a = 1;
}


int main(int argc, char* argv[])
{
  google_breakpad::MinidumpDescriptor descriptor("/tmp");
  google_breakpad::ExceptionHandler eh(descriptor,
                                       NULL,
                                       dumpCallback,
                                       NULL,
                                       true,
                                       -1);
  crash();
  return 0;
}
To compile the source
- Create a simple Makefile
- Add the following contents to the Makefile
PKG_CONFIG_PATH=../
all: breakpad_exercise.c
@ $(CXX) -std=c++11 breakpad_exercise.c -g -o breakpad_exercise `pkg-config –cflags breakpad` -L./client/linux/ -lbreakpad_client -I./ -lpthread
- make
Execute the sample application
- An application of name “breakpad_exercise” will be generated. Copy this executable to the box
- Run the application in the box which will cause segmentation fault:
root@raspberrypi-rdk-hybrid:~# ls
breakpad_exercise
root@raspberrypi-rdk-hybrid:~# ./breakpad_exercise
Crash occured, Callback function called.
Segmentation fault (core dumped)
root@raspberrypi-rdk-hybrid:~#
- A minidump will be generated in the same file
root@raspberrypi-rdk-hybrid:~# ls
40e9abf8-19cc-4b55-cd2bb29f-dbd37900.dmp breakpad_exercise
root@raspberrypi-rdk-hybrid:~#
Coredump
Core dump files generated after an uncaught signal in a process (as a SIGSEGV or SIGQUIT), are generated in the base directory where the program was executed, and the core dumps starts with the name as “core” or “core.PID”.
By default size of the core will be zero, To generate the core, we need to set the size of the core to unlimited.
- ulimit -c unlimited
By default, core will be generated in the current directory with the file name “core“. We can change the core generating directory from current directory to another by editing the kernel configuration file core pattern(/proc/sys/kernel/core_pattern) in the kernel.
-
echo “newpattern” > /proc/sys/kernel/core_pattern
Core pattern is helpful in the case if there are couple of core dumps files in one directory and we don’t know which program caused it.
How to get stack trace?
Make sue the executable is compiled with -g option to turn on the debugging symbols
gdb <executable_path> <coredump_file_path>
After you get inside the gdb-prompt, (on execution of the above command), type;
(gdb) bt full
API Documentation
To know more about SoC/Application level APIs details use in RDK, refer the link Crashupload API Documentation