Telemetry
Introduction
CPE has many metrics that are powerful for the analysis of trends and performance insights. Some sources of those metrics are applications or any of the RDK subsystems and TR-069 values. An easy way to get some application metrics is through the log strings they write to log files. The conventional way of accessing this content has been through the upload of these files to servers and then processing the data from them. However, this content has not been available to the range of operations engineers, analysts, managers, and others who want to search for and monitor issues. Moreover, the current response time is inadequate; a delay of 24 hours is excessive in many instances. To enhance timeliness, the ‘Telemetry’ component is created that enables devices to transmit specific metrics from designated logs and TR-069 at near-real-time intervals.
RDK Telemetry improved on the early practice where the RDK would simply bundle log files once a day and transfer the bundle to a file server. Both RDK-V and RDK-B devices provide telemetry with several key features: more real-time data, configurable metrics or events that the CPE should retrieve and send, improved upload frequency that made the timeliness of this data more relevant to analysts, more sources of metrics and events such as log files or TR-069 parameters, an improved cloud solution for analytics using big data solutions for receiving streams and storing data for reporting, and real-time metrics using terse key/value pairs (e.g., {“Report”:[{“mac”:”AA:BB:CC:DD:EE:FF”},{“TelemetryEnabled”:”true”},{“CpuUsage”:”48″},{“Uptime”:”824″},{“FreeMem”:”2036476″},{“TotalMem”:”1212772″}]}.
Key Features
- Telemetry data transmission to servers at pre-defined intervals
- Leverages logs, different system status information.
- Uses key-value pairs for data upload.
Architecture

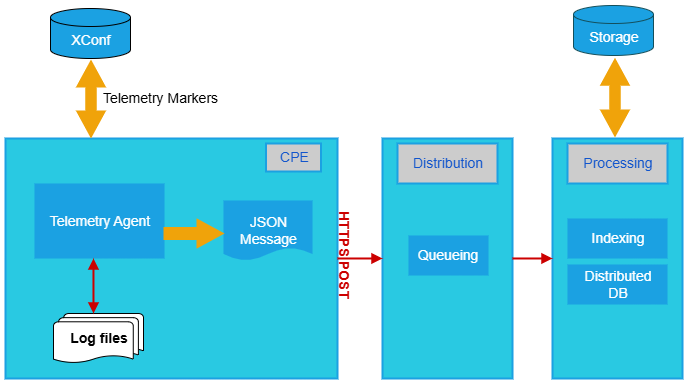
RDK telemetry data is sent periodically from every RDK device, with XConf sending certain parameters during bootup, specifying what parameters to gather and where to retrieve them from, such as logs or status information (e.g., CPU load, memory usage) using system commands. The CPE sends a request to the server with version and device details, and based on server rules, the telemetry agent retrieves telemetry markers from the server, gathers the required data from logs, and packages it into a JSON message. This message is then sent to a server where it is processed and updated in storage, with the server configuring how often it needs telemetry data.
How it works

The telemetry upload process is controlled through the dcm-log service
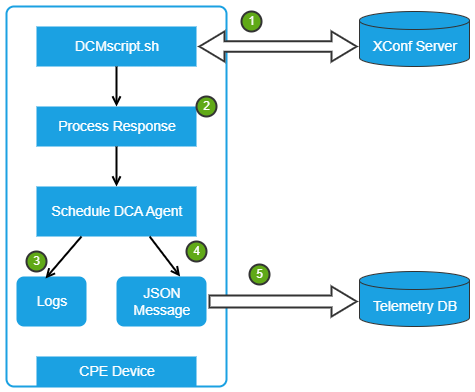
- DCMscript.sh communicates with the XConf server and fetches the predefined markers
- Using the markers, DCM Script will prepare a sorted map file for the log lookup and creates a DCA Agent cron job.
- Cron job retrieves data from the device
- From the retrieved data, it will create a JSON formatted message.
- JSON format data will be uploaded to the server
Telemetry using community XConf server
XConf server configuration procedure:
- XConf Telemetry configuration starts with adding DCM settings as telemetry is a subset of log upload process in general, Below are the steps involved in DCM configuration:
- Add a Upload Repository – Tells Device about the server side file store where log files will be updated
- Add a Formula
- Map the configuration with a build condition (such as a MAC/IP/Model combination)
- Create Log Upload Settings (Tells devices when to upload the logs)
- Create Device settings (Tells when the device should reach XConf for a configuration polling)
- Telemetry configuration can be done by adding a permanent profile which contains below objects
- Upload repository
- Profile options (Header, content, frequency etc.)
- The telemetry marker which is a combination of Header(for identification), Content(string to search in the log files), Type (name of the log file), and Polling frequency (after which iteration to send). Telemetry profile entries can be set depending on the target platform. I.e.RDK-B and RDK-V. Eg:header : mem_rmfStreamer, content : rmfStreamer, type : top_log.txt , and polling frequency : 60.
- Creating a targeting rule which is basically mapping the profile to a set of MAC/IP/Device etc.
Refer Xconf Server – User guide for configuration and feature validation for detailed steps.
Client(device) side verification
- Client side configuration which involves:
- SSH to RPI
- Change the configuration in /etc/dcm.properties
- Debug & check everything is good by restarting the log service and monitoring the log file
Please note that Telemetry is a generic implementation applicable to RDK-V and RDK-B. As a sample, the examples given are purely based on RDK-B.
For detailed steps on configuring the XConf server and validating Telemetry 1.0 features on RDK-B and RDK-V platforms, including sample logs, please click here for RDK-B and here for RDK-V. .
Video client side setup details are captured below:
- Add the following changes in /etc/dcm.properties or verify if the configurations are present.
# DCM properties file
# Log server details
LOG_SERVER=xconf.rdkcentral.com
# Log upload server details
DCM_LOG_SERVER=https://xconf.rdkcentral.com/xconf/logupload.php
DCM_LOG_SERVER_URL=https://xconf.rdkcentral.com:19092/loguploader/getT2Settings
# SCP server details
DCM_SCP_SERVER=xconf.rdkcentral.com
# LA server details
DCM_LA_SERVER_URL=https://xconf.rdkcentral.com/xconf/logupload.php
- Check in /etc/inculde.properties
- From “/etc/include.properties” file need to change “P=” to P=https://xconf.rdkcentral.com:19092/loguploader/getT2Settings
- Check tr181 parameters for telemetry are set, if it is not set, then add set the params
tr181 -s -t boolean -v true Device.DeviceInfo.X_RDKCENTRAL-COM_RFC.Feature.Telemetry.Enable
tr181 -s -t string -v 2.0.1 Device.DeviceInfo.X_RDKCENTRAL-COM_RFC.Feature.Telemetry.Version
tr181 -s -t string -v https://xconf.rdkcentral.com:19092/loguploader/getT2Settings Device.DeviceInfo.X_RDKCENTRAL-COM_RFC.Feature.Telemetry.ConfigURL
- Reboot the box
- Output of /tmp/DCMSettings.conf (contains the telemetry markers that was set against the permanent profile)
urn:settings:GroupName=RDKV-PIF-Telemetry
urn:settings:CheckOnReboot=true
urn:settings:CheckSchedule:cron=2 1 1 1 *
urn:settings:CheckSchedule:DurationMinutes=0
urn:settings:LogUploadSettings:Message=null
urn:settings:LogUploadSettings:Name=RDKV-PIF-Telemetry-Logupload
urn:settings:LogUploadSettings:NumberOfDays=0
urn:settings:LogUploadSettings:UploadRepositoryName=RDKV-PIF-Telemetry-Repo
urn:settings:LogUploadSettings:RepositoryURL=https://xconf.rdkcentral.com/test
urn:settings:LogUploadSettings:UploadOnReboot=true
urn:settings:LogUploadSettings:UploadImmediately=false
urn:settings:LogUploadSettings:upload=true
urn:settings:LogUploadSettings:UploadSchedule:cron=2 1 1 1 *
urn:settings:LogUploadSettings:UploadSchedule:levelone:cron=null
urn:settings:LogUploadSettings:UploadSchedule:leveltwo:cron=null
urn:settings:LogUploadSettings:UploadSchedule:levelthree:cron=null
urn:settings:LogUploadSettings:UploadSchedule:DurationMinutes=0
urn:settings:VODSettings:Name=null
urn:settings:VODSettings:LocationsURL=null
urn:settings:VODSettings:SRMIPList=null
"urn:settings:TelemetryProfile":{"id":"e112c868-d82a-45f6-ba75-4e77beb900ac","telemetryProfile":[

{"header" : "branch_split","content" : "BRANCH=","type" : "version.txt","pollingFrequency":"1"}

,{"header" : "mem_syslogd","content" : "syslogd","type" : "top_log.txt","pollingFrequency":"1"},{"header" : "Version_split","content" : "VERSION=","type" : "version.txt","pollingFrequency":"1"},{"header" : "FREE_MEM_split","content" : "FREE_MEM:","type" : "top_log.txt","pollingFrequency":"1"},{"header" : "USED_MEM_split","content" : "USED_MEM:","type" : "messages.txt","pollingFrequency":"1"},{"header" : "CpuPV_split","content" : "AVS CPU PV =","type" : "messages.txt","pollingFrequency":"1"},{"header" : "SYST_ERR_KernelPanic_reboot","content" : "PREVIOUS_KERNEL_OOPS_DUMP_START","type" : "messages.txt","pollingFrequency":"1"},{"header" : "rfc_split","content" : "Features Enabled]-[ACTIVE]:","type" : "rfcscript.log","pollingFrequency":"1"},{"header" : "cpuinfo_split","content" : "sysint","type" : "<event>","pollingFrequency":"1"},{"header" : "SYST_INFO_ETHConn","content" : "sysint","type" : "<event>","pollingFrequency":"1"},{"header" : "WIFIV_INFO_NOV6ROUTE","content" : "sysint","type" : "<event>","pollingFrequency":"1"},{"header" : "imagename_spilt","content" : "imagename:","type" : "version.txt","pollingFrequency":"1"},{"header" : "mem_TOP","content" : "USED_MEM:","type" : "top_log.txt","pollingFrequency":"1"}],"schedule":"/5 *","expires":0,"telemetryProfile:name":"RDKV-PIF-Rule","uploadRepository:URL":"http://192.168.160.232:8080/telemetry-collector/rdkv-collector","uploadRepository:uploadProtocol":"HTTP"}
- Output of /tmp/DCMSettings.conf (contains the telemetry markers that was set against the permanent profile)

