
Logout
Are you sure you want to logout?
Please enter User name
Please enter Password
cpuprocanalyzer
Created on June 21, 2022
Introduction
- RDK PROC ANALYZER is a tool that enables different teams like development, triage and testing to analyze the CPU and memory utilization of the processes that run on top of RDK framework.
- It helps us in detecting the memory leaks, cpu and memory performance regressions.
- This tool is implemented as a service.
- Highly configurable (Parameters like period , time interval and processes to be monitored can be configured).
Code Flow
- The main code flow of CPU Procanalyzer –
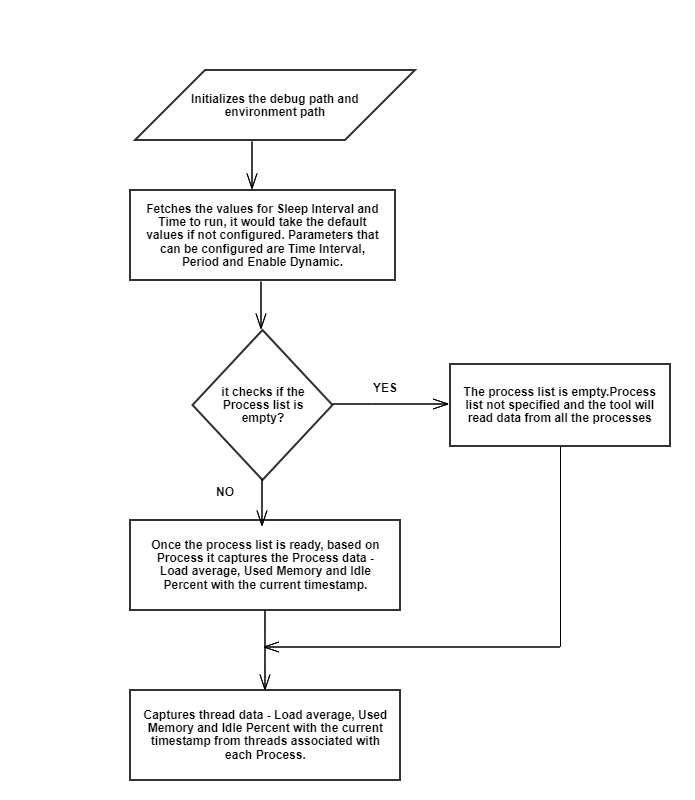
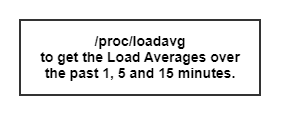
- To get the Load Average information-
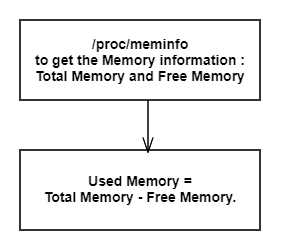
- To get the Memory information-
- To get the Idle Percent Information-

How to Launch
This tool runs as a service.
If the file /tmp/PROC_ANALYZER_ENABLE is touched the tool starts running and it logs the details.
How to Configure:
1 Open ‘/opt/rmfconfig.ini’ file on the device.
Parameters that can be configured:
(a)Time Interval
(b)Period
(c)Enable Dynamic
(a) Time Interval : It is the amount of time the tool runs.

(b) Period        : It is the interval of time for which the tool records the information.

(c)Enable Dynamic : This is a flag to disable and enable the capturing of dynamic processes
                     ( Enable Dynamic = 1 means enable and Enable Dynamic =0 means disable ).
It would take the default values if not configured (sleepsecs:60, Time to run:0, Dynamic:1)
Ex: FEATURE.CPUPROCANALYZER. SLEEP.SECS=60

    FEATURE.CPUPROCANALYER.TIMETORUN.SECS = 0 (which means tool runs until it is killed manually)

    FEATURE.CPUPROCANALYZER.DYNAMIC = 1
2. Open ‘/opt/processes.list’ file on the device.
File to configure process names to be monitored
Go To Top