
RDK Diagnostics
Description
This provides HTML diagnostic clients which can be used for Hybrid Gateway devices as well as IP clients. It also supports retrieving diagnostic values over a TR-069 interface for devices where snmp support is not present (IP client devices). Also additional diagnostic screens to monitor MOCA devices are available.
HTML based diagnostic screens will send a JSON request to the Lighttpd server. This request is converted to a corresponding SNMP trigger or a TR-69 request to retrieve the data and send it back as a JSON response to the HTML client.
Capabilities
- Handle HTTP gets from Diagnostics Application.
- Retrieve data from SNMP and/or TR-069 Clients.
Feature Summary
-
Application access to SNMP MIB objects
- Application access to TR-069 parameters
- Application access to RDK state variables
Diagnostic Parameters (example)
| Parameter | SNMP MIB | TR-069 Object |
|---|---|---|
| MoCA Enable/Disable Status | mocaIfEnable | Device.MoCA.Interface.{i}.Enable |
| Firmware Version | ocStbHostSoftwareFirmwareVersion | SoftwareVersion |
| LAN IP Address | Device.IP.Interface.{i}.IPv4Address.{i}.IPAddress |
State Variables
RDK will signal state variable transitions to application, and application will present the corresponding error messages to the user if necessary.
Diagnostics using SNMP
A glance on SNMP
- Simple Network Management Protocol (SNMP) is an Internet-standard protocol for collecting and organizing information about managed devices on IP networks and for modifying that information to change device behaviour.
- SNMP is the opensource component which is integrated with RDK.
- “snmpd” is the snmp agent which is running in the box.
- All MIBS are available in /usr/share/snmp/mibs/
SNMP MIB
-
SNMP agents maintains a database describing the managed device parameters.
-
Manager uses this database to request the agent to retrieve specific information and further translates the information as needed for the network mangement system .
-
Agent and Manager shares MIB
-
MIBs comprises of managed object identified by the name Object Identifier (OID).
-
SNMP mibs starts with 1.3.6.1.2.1
SNMP Diagnostics
- SNMP queries are used to fetch the details from the box which will be displayed in the “Diagnostics” page
- SNMP is used only in “hybrid” box types and not in client boxes.
- Client boxes use TR069 protocol for fetching diagnostic details.
Steps to display Diagnostics page in PC Browser
- Step 1:
Copy lighttpd config file from /etc to /opt
cp /etc/lighttpd.conf /opt/
- Step 2 :
Modify config file to show the page in browser.
vi /opt/lighttpd.conf
Comment below line
server.bind = “127.0.0.1”
- Step 3:
Execute below command
ps -ef| grep “/usr/sbin/lighttpd” | grep -v “grep” | awk ‘{print $2}’ | xargs kill -9 >& /dev/null;/usr/sbin/lighttpd -D -f /opt/lighttpd.conf &
- Step 4:
Use below url in the browser to see diagnostics page
http://<hybrid box lan ip address>:50050/htmldiag/summary_info.html
eg: http://192.168.160.83:50050/htmldiag/summary_info.html
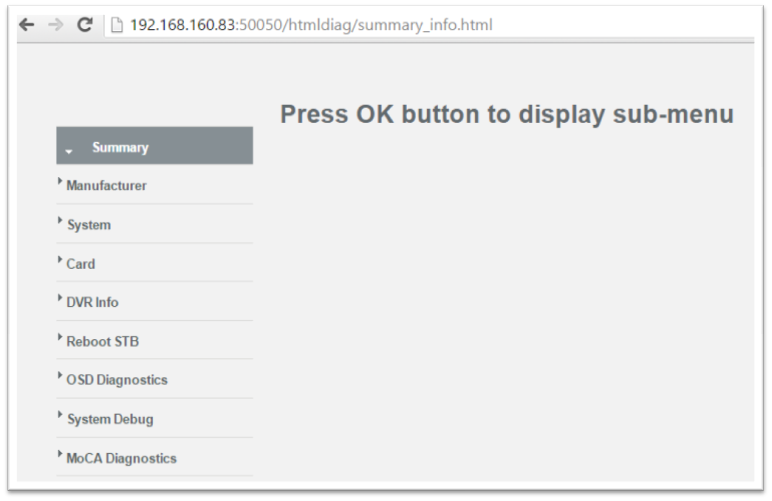
Note: Use TAB, SHIFT+TAB and ENTER keys to browse through this page
SNMP queries through command line
- SNMP queries can be executed command line to fetch the details
- Execute below commands in the box console to see the output of the query
Example 1: Querying card binding status
snmpwalk -OQ -v 2c -c public 127.0.0.1 OC-STB-HOST-MIB::ocStbHostCardBindingStatus.0
Expected Output :

It shows that card is not authenticated for paid channels
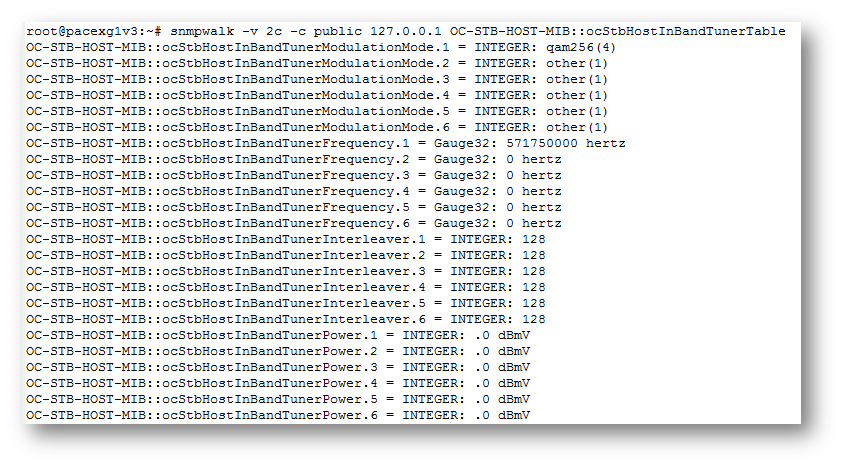
Example 2: To check signal strength
snmpwalk -v 2c -c public 127.0.0.1 OC-STB-HOST-MIB::ocStbHostInBandTunerTable
Example 3: For HDMI status returned by TV
snmpwalk -OQ -v 2c -c public 127.0.0.1 OC-STB-HOST-MIB::ocStbHostDVIHDMITable

Diagnostics using TR069
- TR069 queries are used to fetch the details from the box which will be displayed in the “Diagnostics” page
- TR069 is used only in “client” box types and not in hybrid boxes.
- Hybrid boxes use SNMP protocol for fetching diagnostic details.
Steps to display Diagnostics page in PC Browser
- Step 1:
Copy lighttpd config file from /etc to /opt
cp /etc/lighttpd.conf /opt/
- Step 2 :
Modify config file to show the page in browser.
vi /opt/lighttpd.conf
Comment below line
server.bind = “127.0.0.1”
- Step 3:
Execute below command
ps -ef| grep “/usr/sbin/lighttpd” | grep -v “grep” | awk ‘{print $2}’ | xargs kill -9 >& /dev/null;/usr/sbin/lighttpd -D -f /opt/lighttpd.conf &
- Step 4:
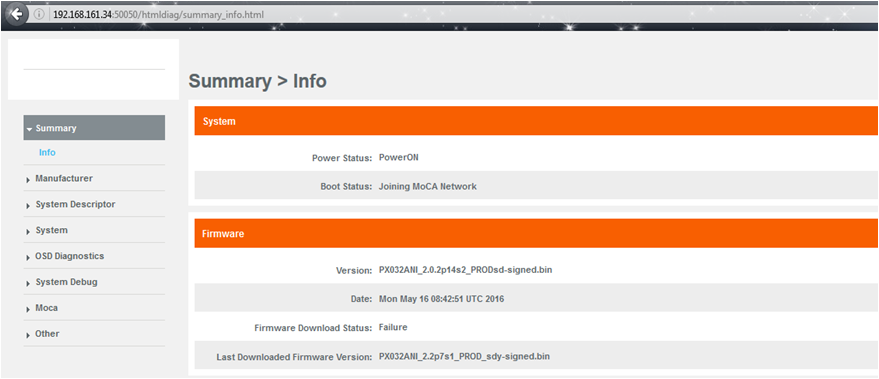
Use below url in the browser to see diagnostics page
http://<client box lan ip address>:50050/htmldiag/summary_info.html
eg: http://192.168.160.34:50050/htmldiag/summary_info.html
TR-069 queries through command line
-
TR 060 queries can be executed command line to fetch the details using curl to query tr69Hostif
-
Execute below commands in the box console to see the output of the query
Example 1: To fetch number of entries in the HDMI table
curl -d ‘{“paramList” : [{“name” : “Device.Services.STBService.1.Components.HDMI.1.Status”}]}’ http://127.0.0.1:10999

Example 2: To fetch Human-readable name associated with this video decoder
curl -d ‘{“paramList” : [{“name” : “Device.Services.STBService.1.Components.VideoDecoder.1.Name”}]}’ http://127.0.0.1:10999

Example 3: To fetch the device total cpu usage
curl -d ‘{“paramList” : [{“name” : “Device.DeviceInfo.ProcessStatus.CPUUsage”}]}’ http://127.0.0.1:10999

Steps to display Diagnostics page in PC Browser